Paolo Di Lorenzo
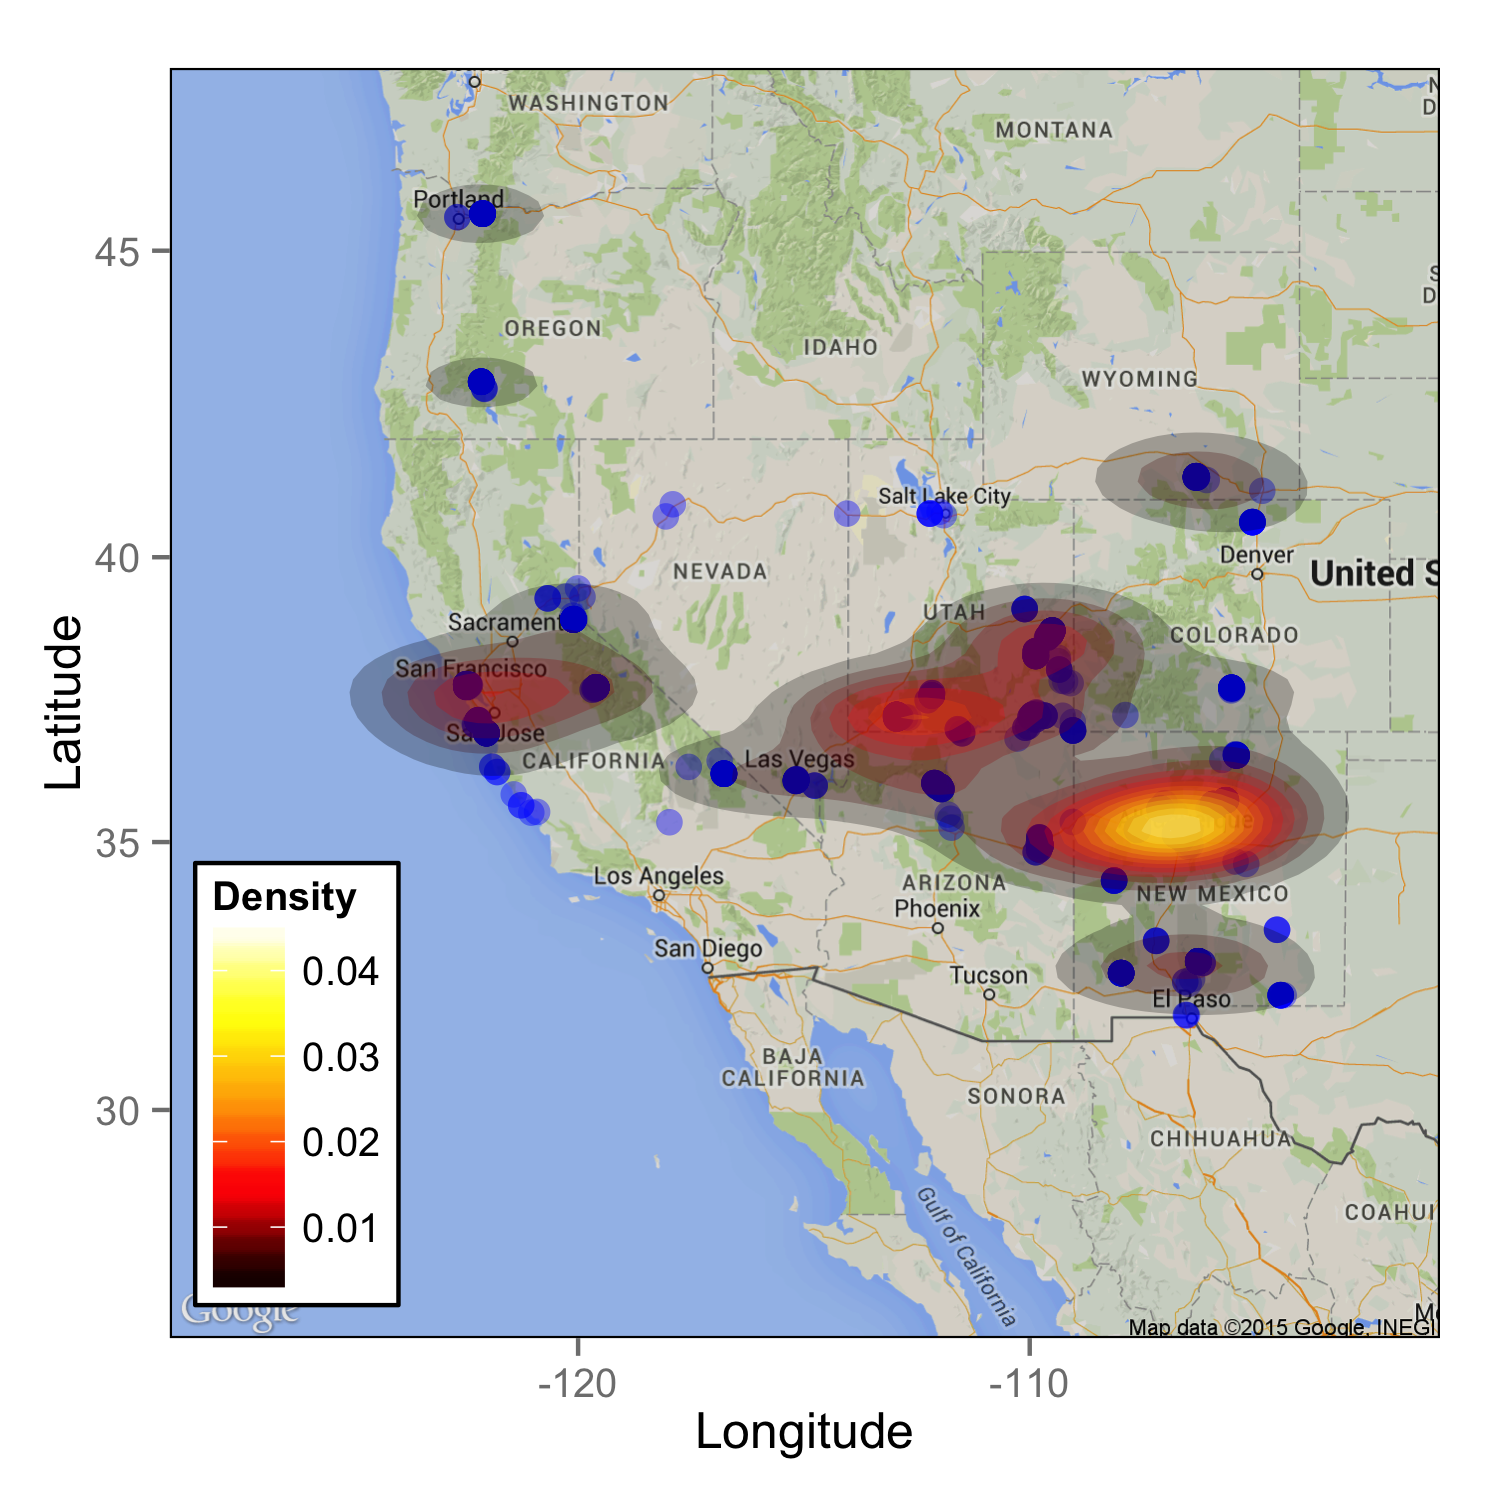
Below is a density plot of the locations of photographs I've taken in the southwestern United States (created with 
ggplot2 and ggmap in R):
